Capital Raise Structure & Timing
A staged institutional capitalization designed to fund immediate acquisitions and near-term expansion.
Month 0
$65M
Initial equity for immediate acquisitions, control transactions and launch-stage development equity.
Month 5
$89M
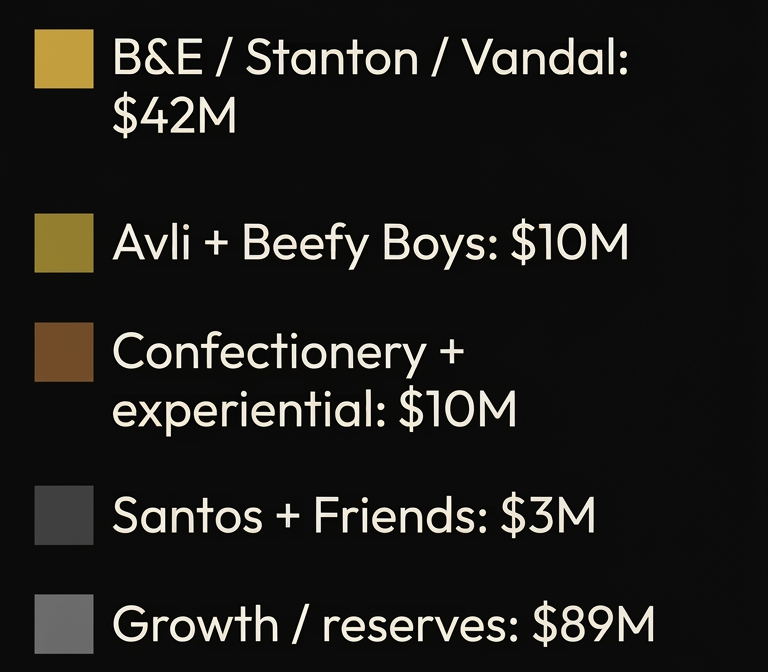
Second close / expansion capital for new market development, reserves and additional venue equity.
36 months
$86M
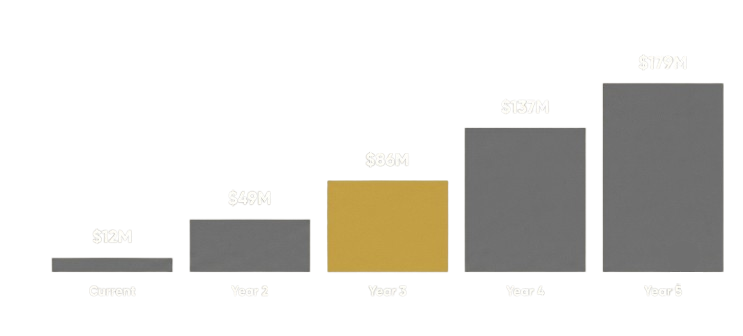
Management-targeted EBITDA scale after acquisition integration and new unit development.
36-60 months
Exit
PE recap, strategic sale, PropCo monetization or hybrid transaction.
Investor Configuration
Targeting a limited investor group with high-conviction checks, including a stated $30M minimum check size and simplified governance to support fast diligence and IC approval.
Sources & Uses of Capital
Capital is allocated across acquisitions, new market development, real estate equity and liquidity reserves.
Sources
$65M initial equity raise
$89M second close / expansion capital
Senior debt and real estate financing for venue acquisition and construction
Revolving credit facilities for operating liquidity
Primary Uses
Immediate brand / venue acquisitions
New unit development equity
REO Venue acquisition deposits and equity
Pre-opening, working capital and contingency reserves
Development Financing
$581M new market development plan over 36 months
$89M cash need vs. $357M mortgage debt identified in management model
Debt sizing based on project-level underwriting and lender diligence
Illustrative Equity Deployment


Current Scale and 36-Month Target Economics
Management model targets a step-change in EBITDA through acquisitions, market expansion and real estate value capture.
EBITDA Build - Management Case
Value Creation Drivers
New unit development and relaunch of proven brands
Margin expansion from centralized purchasing and labor controls
REO Venues equity value through lease-up, appreciation and refinancing
Exit multiple expansion from single-concept economics to institutional platform scale
Unit Economics & Development Discipline
Targeting high-volume concepts with strong cash-on-cash return potential and real estate-linked asset value.
$8M-$12M
Average unit volume
Concept-dependent
14%-20%
EBITDA margins
Stabilized target range
$6M-$14M
Build cost / unit
Varies by market and brand
3-4 yrs
Payback period
Target range
Underwriting Guardrails
Prioritize second-generation hospitality spaces to control CapEx and timing risk.
Require market-by-market site selection backed by tourism, density and income data.
Standardize brand design packages, opening playbooks and project-level budget controls.
Size debt to DSCR and cash-flow resilience rather than maximum leverage.
PE Relevance
Institutional investors can underwrite a repeatable operating model, not isolated venue stories.
Real estate ownership/control creates collateral value and reduces long-term rent leakage.
The strategy can support a larger equity commitment because capital is deployed across multiple brands and markets.